With the U.S. economy continuing a slow but steady recovery, more job growth, more consumer confidence and increasing sales are anticipated for 2016.
The world economy in review
Six years after the world economy emerged from the Great Recession of 2009, a return to a strong global expansion remains elusive. The downside risks to the world economy appeared more noticeable than ever in 2015. Economic growth has improved in the advanced economies—the United States, Japan and Europe. But activity in emerging and developing economies was slow for the fifth year in a row; reflecting weaker prospects in 2016 for some large emerging economies—such as China—and oil exporting countries such as Russia and Saudi Arabia.
Worldwide growth in GDP in 2015 was 3.1 percent—0.3 percentage points lower than in 2014. Growth in U.S. GDP in 2015 was down slightly, coming in at 2.2 percent—0.2 percentage points below 2014. This decrease in 2015 was due, in large part, to the strong U.S. dollar, which makes it more expensive to sell U.S. exports to foreign markets. In the fourth quarter of 2015, many U.S. companies scaled back inventory because overseas demand had weakened as economies from Europe and China to South America and Africa struggled with their own growth problems.
The economic recovery in the euro area over the past two years is continuing. Domestic demand is expected to remain the driver of the recovery, supported by progress made in terms of fiscal consolidation, low oil prices and weak but improving labor markets. GDP growth in the 19-nation Eurozone was 0.9 percent in 2014. It reached 1.5 percent in 2015 and is expected to reach 1.6 percent in 2016.
China’s economy had a rough ride in 2015. GDP growth in 2015 was reported at 6.8 percent, the weakest since 1990. Many analysts have estimated China’s GDP to be even lower, closer to 5–6 percent, well short of the Chinese government’s 7 percent target for 2015. The industrial sector has been hit hard, with the country’s northern rustbelt on the brink of a recession. From June into August of 2015, it suffered from a stock market collapse causing global and Chinese companies to lose roughly $3.9 trillion dollars in value. While China’s economy will slow in the coming years, it will still be one of the fastest growing countries among the world’s economies. China’s GDP in 2016 is expected to grow 6.3 percent.
In 2015, the United States continued on the path to sustained economic improvement, realizing consistent, gradual growth in GDP, a greatly improved job market, increased consumer confidence and consumer spending above 2 percent. Other regions across the globe—for example, China and Russia—have incurred economic slowdowns, which have constrained growth in the worldwide economy, including the specialty fabrics industry.
U.S. and world markets overview
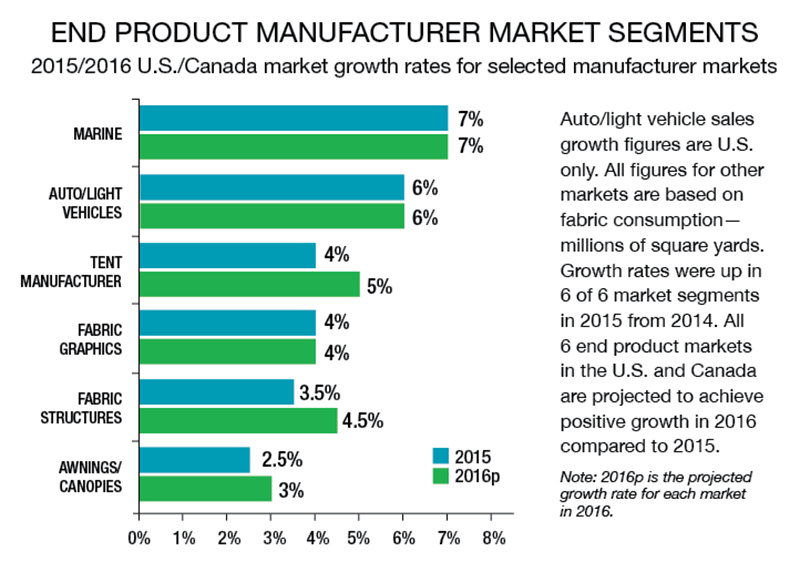
All but one of the traditional end product market segments regularly monitored by IFAI achieved single-digit sales growth in 2015. (The military market was flat in 2015.) The marine fabrics market tops the list—growing at 7 percent. Investing in state-of-the-art equipment, lean/quality improvement manufacturing practices, training staff and developing and marketing innovative products targeted to customers have helped keep these businesses in the black.
 The world market for specialty fabrics grew approximately 2.4 percent in 2015 and is expected to achieve sales growth of 2.5 percent in 2016. Constraints on global growth in the specialty fabrics market in 2015 were largely attributable to a slower growth rate of 3.1 percent in worldwide GDP. The decline reflects a striking slowdown in the economies of emerging markets like China; this slowdown was offset by strong consumer spending in the United States.
Growth in the U.S. specialty fabrics industry was about 2.4 percent in 2015, and is expected to reach 2.6 percent in 2016. That growth will depend on the continuation of a low unemployment rate between 5.0 and 5.5 percent, a continued increase in consumer spending above 2 percent and continued low oil prices.
Despite the improvements in the unemployment rate in 2015, consumers are still very cautious about spending. Still, we do expect to see a 2.7 percent increase in consumer spending in 2016, as people remain confident that the U.S. economy will continue to expand at a consistent, gradual pace.
Key Markets
Awnings and canopies
In 2015, growth was up 2.5 percent in the U.S./Canadian end product manufacturer (EPM) awnings and canopies market. Factors contributing to the growth included an increase of nearly 5 percent in existing home values in 2015. New home sales soared 18 percent in 2015; that momentum is expected to continue in 2016, with an anticipated increase of 20 percent. Housing starts are expected to increase by 17 percent in 2016 to 1.3 million, after an increase of 13 percent in 2015.
In 2015, metal awnings represented about 15% of all awnings sold in the U.S.; fabric awnings represented about 84%, with the remaining 1% from other materials.
Many homeowners are expected to use this rising home equity to remodel their homes in 2016. According to the National Association of Home Builders Remodeling Market Index (RMI), the RMI figure for third-quarter 2015 was 57—the tenth consecutive quarter above 50. (An RMI above 50 indicates that more than half of remodelers are reporting increasing market activity.)
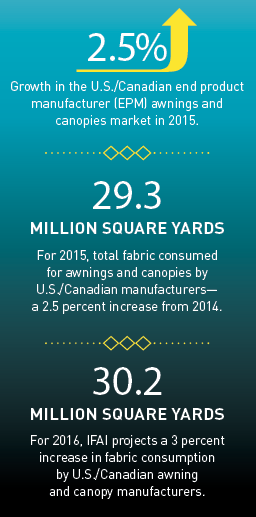 Construction activity increased significantly in 2015. Total U.S. construction was up 10.7 percent from 2014; residential construction was up 13 percent and nonresidential construction 9.5 percent. For 2015, total fabric consumed for awnings and canopies by U.S./Canadian manufacturers reached 29.3 million square yards—a 2.5 percent increase from 2014. For 2016, IFAI projects a 3 percent increase in fabric consumption by U.S./Canadian awning and canopy manufacturers, to reach 30.2 million square yards.
For the first time in three years, the U.S. and Canada had fairly normal weather conditions in spring 2015. The result was a longer selling season for awnings in 2015, which translated into a noticeable improvement in sales. Over the past few years, increasing sales of metal awnings has cut into sales of fabric awnings. In 2015, metal awnings represented about 15 percent of all awnings sold in the U.S.; fabric awnings represented about 84 percent, with the remaining 1 percent from other materials.
Outlook for the awnings and canopies market. In November 2015, a survey was sent to U.S. and Canadian awning suppliers and end product manufacturers. Seventy-seven percent of respondents reported that compared to sales in 2015, the business outlook would be somewhat better in 2016. A steadily growing economy, a 5 percent increase in home values, unemployment close to 5 percent and (weather permitting) an earlier start to the selling season should lead to a 3 percent increase in sales in the U.S./Canadian awning market in 2016.
Marine
New boat unit sales increased 5 percent in 2015, and 8–9 percent in terms of value. New boat unit sales in 2016 have a good chance of growing 6–8 percent compared to 2015. Pre-owned boat sales were up 6 percent in 2014 compared to 2013. Marine aftermarket accessories sales reached $5.6 billion in 2014, an increase of almost 15 percent from the previous year.
Developments in 2015 supporting future growth in the marine fabric market:
- A steady U.S. economy with GDP achieving 2.2 percent growth from 2014
- A noticeably improving housing industry
- A stronger job market—unemployment rate at 5.3 percent in 2015 vs. 6.2 percent in 2014
- A consumer confidence index above 90 for 14 straight months—a figure that historically correlates to a well-performing marine fabric industry
- Consumer spending above 2.5 percent
- Low oil and gas prices in 2015 and 2016
Low fuel prices are expected to continue through 2016, bolstering people’s financial outlook, which bodes well for new boat sales and pre-owned boat sales. Continued growth in recreational boating is projected to last until at least the middle of 2018. More people in the U.S. are taking to the water; some 89 million Americans went boating in 2013. Reportedly, 90 million people participated in recreational boating at least once in 2015.
Outlook for the marine market. Sales, in terms of volume, in the 2015 U.S./Canadian marine fabric end product market grew 7 percent to 26.6 million square yards. Sales are projected to grow another 7 percent in 2016—reaching 28.5 million square yards. Gradual improvement in the U.S. and world economy in 2016 will be a key driver in fueling this growth, as will the strong 6–8 percent growth in new boat sales in 2016, underpinned by a 2 percent growth in pre-owned boats and the re-cover market.
The Conference Board’s consumer confidence index, a key barometer for growth in the marine fabric market, averaged 97.9 in 2015, up 11 points from 2014.
The Conference Board’s consumer confidence index, a key barometer for growth in the marine fabric market, averaged 97.9 in 2015, up 11 points from 2014. This marks the fifth year of increases in a row since IFAI began tracking these figures. This growth is expected to continue into 2016; in general, a consumer confidence index of 90 or more means increased consumer spending—especially in the marine fabric market.
Strong growth in revenue
Revenue growth in 2015 for U.S. boat manufacturers (OEMs) like Brunswick reflected a strong increase in units shipped to dealers, as well as higher average selling prices. At the wholesale level, U.S. boat building forecasts underscore the bright prospects for boat sales in 2015 through 2017 in the United States. The forecasts:
- 2015 boat production increased 11.8 percent compared to 2014
- 2016 boat production is expected to grow 8.8 percent compared to 2015
- 2017 boat production is expected to grow 8.7 percent compared to 2016
Fabric graphics
In 2015, total fabric consumed by U.S. and Canadian fabric graphics fabricators reached 39.6 million square yards, up 4 percent from 2014. For 2016, consumption in the U.S./Canadian market is forecasted to reach 41.2 million square yards, up 4 percent from 2015.
Industry trends. Slow-to-moderate growth in the U.S. economy led to the ongoing use of low-pricing tactics among some print shop operators in 2015; these tactics helped to increase sales but also hurt in terms of reduced profit margins. Despite these pricing tactics by some players in the marketplace, many print shop operators have also resisted passing along price increases to customers for fear of losing business to price-cutting competitors.
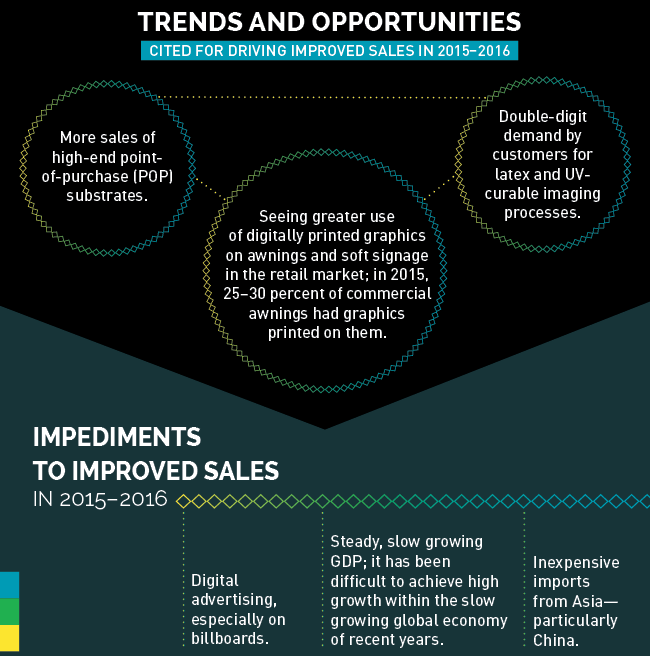
There has been a surge in growth in the home furnishing décor market; the impact of this growth has helped to drive solid growth in the latex and UV-curable fabric graphics market segments. Soft signage continued to realize double-digit growth in 2015 as more wide-format printer vendors entered the decorative printing market, and sales are expected to continue to increase in the foreseeable future.
The continuing increase in the use of Silicone Edge Graphics (SEG) framing systems was a notable development in 2015—so much so that tension fabrics and SEG systems have become the new exhibit standard at trade shows. Dye sublimation transfer remains the number one imaging process used by fabric graphics operations and print shops across the United States.
Outlook for the fabric graphics market. The biggest growth area for fabric graphics applications will continue to be in dye sublimation products. Wide-format graphics products (3-5 meters wide) will continue to grow as corporations maintain their commitment to investing resources into product and company promotions and advertising. Double-digit growth will continue in soft signage—especially point-of-purchase (POP) signage in retail settings.
In a November 2015 survey by IFAI, respondents reported they think the U.S./Canadian fabric graphics market will be somewhat better in 2016 than it was in 2015.
Fabric structures
The U.S./Canadian fabric structures market experienced growth of 3.5 percent in 2015 and is expected to grow 4.5 percent in 2016. The sluggish U.S. economy is showing signs of growing beyond the dawdling-to-moderate growth of the last few years (2.4 percent in 2014 and 2.2 percent in 2015). Consumer confidence and subsequent demand continued to increase in 2015; both are expected to maintain an upward trajectory through 2016. These economic barometers signify increasing demand, a boon for the U.S. fabric structures market in coming years.
In 2015, the size of the U.S./Canadian fabric structures market was 10.1 million square yards. It is expected to reach 10.6 million square yards in 2016.
Outlook for the fabric structures market. In a November 2015 survey by IFAI, respondents reported they think the U.S./Canadian fabric structures market will be somewhat better in 2016 than it was in 2015.
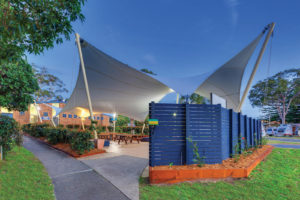
The fabric structures market has seen steady growth since 2012, with annual growth rates ranging from 2 percent in 2012 to a projected growth rate of 4.5 percent in 2016. Product awareness is growing as building structure customers are more and more realizing the aesthetic quality and flexibility that fabric structures provide (and that can’t be duplicated by traditional materials).
Trends and opportunities
Spurring sales in 2015-2016
- More projects occurring in infrastructure development—for example, shade structures at transportation depots, bus stops and parking lots.
- Seeing a broader umbrella of fabric structure applications—such as auto dealerships, large and small outdoor sporting events for golf and tennis, schools, parks and urban developments.
- A continuing increase in demand for engineered structures—incorporating more engineering requirements, which has also increased the costs for these projects.
- Continued replacement of aging structures.
- The quality of fabrics continues to improve—fabrics have better durability, longer life spans, and retain color longer after repeated exposure to weather and UV degradation.

Tent rental and manufacturing
This is a very competitive market. There are thousands of companies competing to rent tents and tent-related equipment to weddings, fairs and public and private events of all types. In terms of volume, sales for the U.S./Canadian manufacturer market were 23.2 million square yards in 2015, up 4 percent from 2014. Sales are projected to be 24.4 million square yards in 2016, up 5 percent from 2015.
The party and event rental market grew 6 percent in 2015 and is expected to grow by 7 percent in 2016. The corporate event market also improved in 2015; it’s estimated to have grown about 3 percent in 2015 and should reach 4 percent growth in 2016. The scope of corporate events saw a noticeable increase in 2015 as budgets expanded from the economies of the post-recession years.
Trends in tent rental
Key trends in the tent rental market in 2015:
Tent event customers are increasing their budgets for events; events have become larger and more complex; customers are spending more money for full floors and décor. As a result, event tent operators are carrying more staff and inventory.
There is more demand for tent sidewalls, liners and flooring. As a result, event operators continue to market their organizations as full-service event professionals; they sell the entire event offering—the tent itself, flooring, lighting and accessories.

Tents are becoming more user-friendly and easier to install.
Sailcloth tents are becoming more popular—especially in the fast-growing wedding market. They are visually appealing, with sculpted peaks and eaves that create an open-space feel at outdoor events.
For the second year in a row, clearspan tents have been growing; they are largely serving the demand for bigger, more complex events.
Government regulations and permitting are increasing; event operators are spending more time acquiring the proper permit so they’re in compliance with building codes.
Outlook for the tent rental and manufacturing market. During the last few years, tent event operators have done a better job of marketing their tent rental offerings to their customers; both corporate and party events grew in popularity in 2015. Customers are spending more money on larger events. In 2016, look for corporate and party events to attain their highest growth since the Great Recession in 2009.
Industry outlook
Leaders in the industry interviewed at IFAI Expo 2015 reported that they are somewhat optimistic about sales prospects for 2016. The feeling is that the economy is going to be better than it was in 2015—with more job growth, leading to greater consumer confidence and resulting in more consumer spending on specialty fabrics.
Increased sales in 2016 and beyond will be largely captured by those players in the specialty fabrics industry who have regularly invested in resources for developing innovative products, entering new markets and exploring ways to get closer to the customer—such as improving the logistics supply chain. Some of the developments market participants should see in 2016 include:
- Greater consumer demand overall for their products and services
- Relief from high raw material costs; oil prices will remain low at about $39 per barrel
- Losing sales to overseas competition may again ease a bit, as fabrics imported from countries like China should decrease as China struggles to stabilize its domestic economy
Industry participants who actively look for opportunities in the marketplace and take advantage of them will continue to separate themselves from competitors who continue to do business as usual. The successful players in the specialty fabrics industry already know they must continue to commit to investments: pushing the envelope in terms of developing and delivering innovative products every year, and reinventing the company’s overall business model every 5-10 years; and improving internal business processes such as the logistics supply chain and lean manufacturing techniques.
Key to the success of any company is to vigorously and continuously pursue meaningful ways to ensure that products and services are relevant and important to customers and potential customers. Successful market participants have committed to this mission by creating and delivering innovative products and employing marketing mediums, tactics and messages that truly connect with the customer, through trade shows, advertising and promotional offerings, public relations and community relations.
Jeffrey C. Rasmussen is IFAI’s market research director. Contact him at jcrasmussen@ifai.com, +1 651 225 6967.
 TEXTILES.ORG

